My last post was about Charles Wheatstone’s invention of the stereoscope, and the simple version that I made for demonstration purposes. Following Wheatstone’s investigations into binocular vision and stereopsis – our perception of depth or three-dimensionality – his stereoscope was adapted for other uses.
First it evolved into a popular entertainment. This development was made possible by Professor David Brewster’s 1849 proposal that two lenses, rather than two mirrors, could be used as the mechanism for directing the two images in the stereoscope to the viewer’s eyes. Various models of this lenticular stereoscope were designed during the nineteenth-century, including simple, cheap, handheld devices that amused the masses with “magical” three-dimensional views of famous places, humourous scenes and, inevitably, pornography.
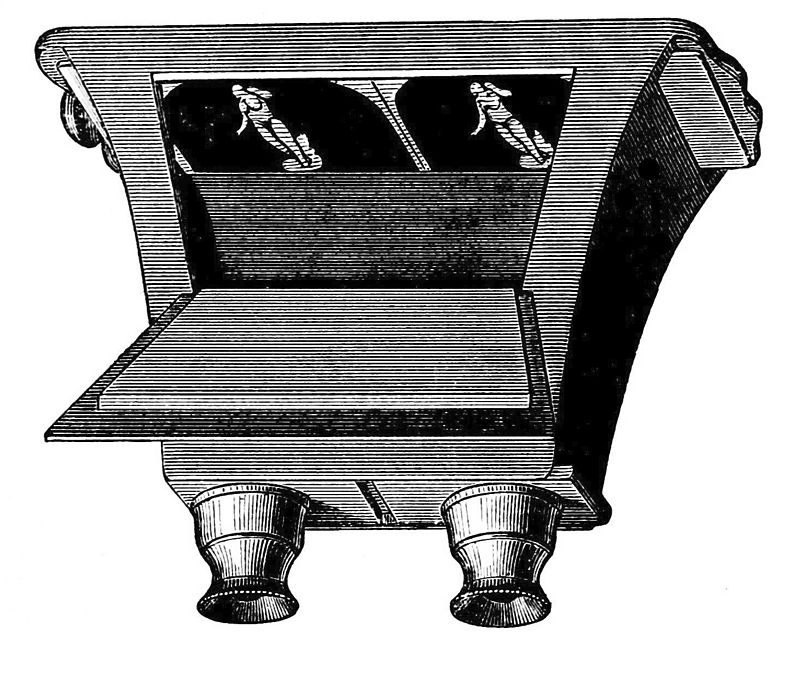
Brewster’s stereoscope: slide a stereo pair of images into the back and look through the binoculars to see a 3D image (image via wikimedia commons).
In the meantime, the stereoscope was being put to more serious uses, one of which was map-making. Known from the late-1880s as “photographic surveying”, this was the beginning of modern photogrammetry.
During the later nineteenth-century, geometrical methods of recording heights and distances from single ground photographs were being used for topographic mapping, most notably in Canada. In a country with vast, un-mapped areas of mountainous terrain, it was expensive to send teams of surveyors out to make detailed maps using traditional methods. Having triangulated an area to establish the essential framework, it was more economical to take panoramic photographs from carefully recorded camera stations and map the detail from each photo, back at the office.
The pioneers of photographic surveying, Aimé Laussedat and Edouard Deville, started by plotting from single photographs taken from positions that gave the best view of the area being mapped. Using a pair of stereoscopic images (a stereogram), however, enables the precise recording of three-dimensional co-ordinates using the 3D image created in a stereoscope.
Making use of this advantage, in 1901 Carl Pulfrich (at the Carl Zeiss Works, Jena) and Henry Fourcade (in Cape Town, South Africa) independently produced designs for stereo-comparators. These were in effect lenticular stereoscopes with additional instrumentation, so that X, Y and Z measurements could be made from a pair of ground photographs viewed in stereo. The map-maker would make calculations using the three measurements from the stereogram and manually transfer the resulting point to a plot, then “join the dots” to draw up the contours of the landscape.
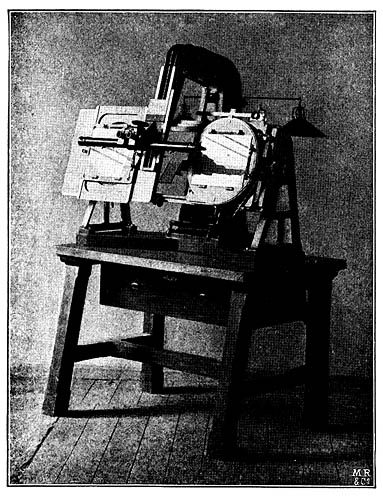
A Pulfrich stereo-comparator photographed in 1904: the two photographs are placed on the plates, and viewed through the binoculars to reveal the 3D image in the mind of the viewer. The apparatus allows the viewer to measure dimensions across (X axis) and up-and-down (Y axis), but also height (Z axis) (image via Max Planck Institute for the History of Science).
A disadvantage of the stereo-comparator was that it involved these two operations: viewing the stereogram to take measurements; making a set of calculations and transferring the measurements to the map plot. Between 1869 and 1902 Edouard Deville, Surveyor-General of Canada, invented a different device based on Wheatstone’s reflecting stereoscope with which contours could be “traced” directly from the stereogram.

Edouard Deville’s plotter: at its heart is a Wheatstone mirror stereoscope. It also has the plotter, the device at the back of this image with a vertical plate and an upright pencil fixed in the base (image from Deville 1902).
The pair of stereo photographs, produced as transparencies, were mounted in frames B. They are reflected by the mirrors mounted at A, and viewed by the map-maker through eye-holes in the propellor-shaped viewing stand. The 3D image of the landscape is created in the viewer’s mind. This image appears to fall onto the vertical plate of the plotter, C. This plate has a tiny pin-prick of light at its centre. By moving the plotter, this pin-prick is moved about the 3D image. The pencil in the base of the plotter leaves marks on the plotting table.
Deville’s stereo-plotter was brilliant for its simplicity, but it had a significant drawback. All the observations were made through the fixed viewing stand A, which therefore had to be changed for each map-maker in order to accommodate the different interval of each person’s eyes. This also affected the scale of the plot, which would be slightly different from each operator. Every finished plot would have to be laboriously re-drawn to the desired scale.
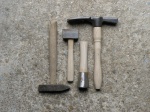
To make this invention easier to understand, I built a simple working model and demonstrated it using aerial photographs. Here it is, fitted with the same pair of Wheatstone’s drawings from my previous blog post for you to compare.


Imagine this apparatus standing on a table. You would be able to sit with your face in front of the two mirrors. The drawings would appear to be one, 3D, image of a cone. Switch on the light in the plotter. Move the plotter until the pin-prick appears to touch the base of the cone. Mark the plotting table with the pencil. Pull the plotter towards you until the pin-prick reaches the top of the cone and mark the table. Now you can measure how tall the cone is.
This is a very basic version of Deville’s plotter. To create “see-through” mirrors I used sheets of the sticky-backed plastic used to tint car windows, because I didn’t have enough time to silver the glass myself. Proper silvering would be a great improvement. The pin-prick of light is a 3 amp LED run on a watch battery, assembled in a little cardboard box with a cardboard switch. The glass sheets were scrap rescued from a 1950s window, and very thin and fragile (the masking tape folded over the top of each sheet helps to prevent cuts!). Nevertheless, it works!
Deville, E. (1902) “On the use of Wheatstone Stereoscope in Photographic Surveying” Proceedings and Transactions of the Royal Society of Canada Second Series, Vol. VIII:63-69